
Monitor
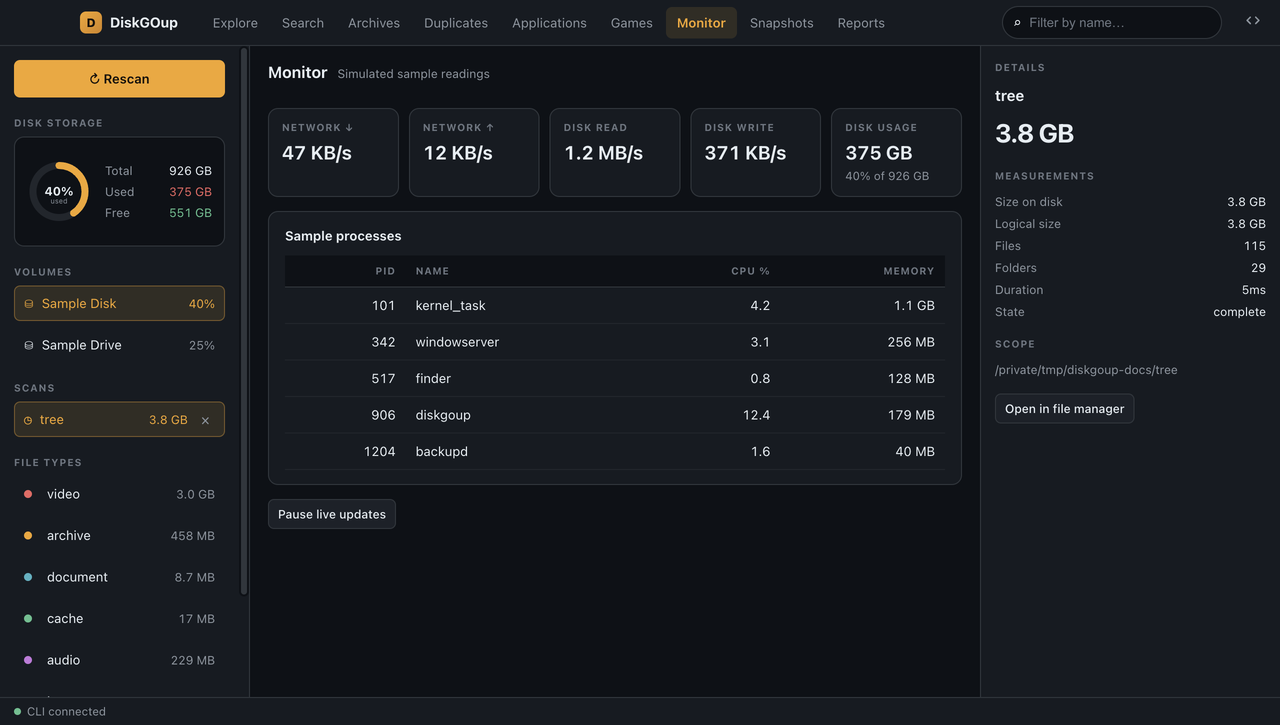
The Monitor section shows what the machine is doing right now:
- Network ↓ / ↑ — the current transfer rates.
- Disk read / write — the current rates.
- Disk usage — how much of the volume is in use, and the share.
Below that is a table of the sample processes with their PID, their CPU share and their memory.
The readings refresh every two seconds. Pause live updates stops the refresh; Resume live updates starts it again.
The section is a sample of the counters the platform reports — it does not scan the disk, and it does not touch the scan index. See Live monitor for the command-line equivalent.